

Rising or Falling? How to Read Home Price Headlines in Austin
Home prices are rising and falling at the same time right now, and which story you hear depends on what market the headline is measuring.
I get asked about this almost every week. A client forwards me an article saying prices are dropping. The next morning, a different article lands in their inbox saying prices are still going up. Both writers can be telling the truth, because they are usually measuring different places or different numbers entirely.
The Fall Dip in Asking Prices Happens Every Year
Much of the "prices are falling" talk this fall comes from asking prices, and asking prices soften after every summer.
According to HousingWire Data, the national median asking price slipped from $449,000 in early August to $435,000 two months later. That works out to about 3%. Inventory plays into it as well. There are more homes for sale nationally than at any point since November 2019, and with mortgage rates climbing since spring, those homes are taking longer to find their buyer.
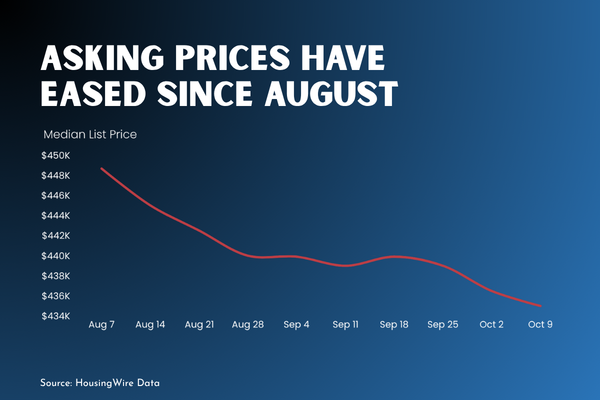
Once the summer rush ends, fewer buyers are out looking. Sellers who still need to move price a little sharper to catch the ones who remain, and they also price to what a buyer can actually borrow at today's rates. I see that as sellers being realistic about the market in front of them. A well-priced home sells, while an overpriced one sits, which is exactly what I walked through in Selling Your Austin Home This Fall? Get These 4 Things Right.
There is one more catch. A national asking price tells you what sellers across the country are hoping for. It tells you nothing about what a buyer just paid for the house down your street.
Where You Live Rewrites the Whole Story
Realtor.com put it this way:
"While national headlines might suggest a buyer’s market is taking hold, the reality on the ground depends heavily on where and what you’re trying to buy. Local trends can diverge sharply from national averages, especially when you factor in price range, property type, and post-pandemic market dynamics."
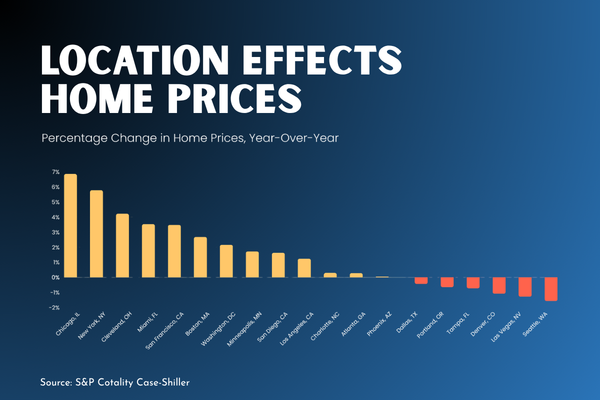
The latest S&P Cotality Case-Shiller Index shows how wide that gap can get. Over the past year, sale prices in Chicago rose almost 7% while Seattle's slipped about 1.6%. Two major cities, nearly 9 percentage points apart.
That spread should change your plan. A seller in New York, where prices are up close to 6%, may not need a price cut at all. Shopping in Denver or Las Vegas? You likely have more room to negotiate.
Austin Had Both Headlines in Back-to-Back Months
Austin proves the point without ever leaving town.
In August, the City of Austin's median sale price fell 4.3% year-over-year to $560,000, according to Unlock MLS. One month later, the September 2026 Central Texas Housing Report showed the city median up 4.2% to $570,958, even though closed sales dropped 12.7%. A reporter writing in early September would have told you Austin prices were falling. By mid-October, the same reporter could honestly say they were rising.
Neither headline says much about Mueller. Here, five single-family homes closed in September at a median of $962,360, or $454 per square foot. Our third-quarter median price came in 3% higher than last year, even with 7% fewer closed sales. I broke down every one of those sales in my September 2026 Mueller Market Update, and the month before tells a different story again in my August 2026 Mueller Market Update.
City inventory also fell 10.3% in September. For a seller with a well-prepared home, less competition heading into winter is good news.
A Small Dip Is a Long Way From a Crash
Among the major metros where prices are down, the declines are 2% or less. That is nowhere near 2008. Look across the Case-Shiller cities and you will find more of them posting gains than losses.
The long view is even steadier. The Federal Housing Finance Agency reports that national home prices have grown year-over-year every quarter since 2012. Go back to 1991, and a $100,000 home bought then would be worth about $436,000 today. That figure already has the 2008 crash baked into it.
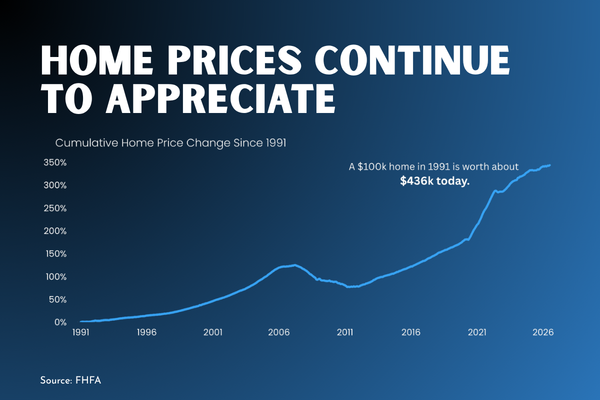
The markets slipping now are mostly the ones that ran hot during the pandemic. Austin was one of them, and we went through our correction earlier than most. What I see today looks like a market finding its normal rhythm again, and over time a normal market gains value. That steady equity is a big reason more of my clients are making a 20% down payment on their next home.
What This Means for Your Next Move
Your home's value comes from the sales around it, so that is where I start every pricing conversation.
Before you set a list price or write an offer, I'll pull recent sales in your neighborhood and your price range so we can see how quickly comparable homes are actually moving. If you'd like to follow those numbers month by month, I share them in my Real Estate Market Updates on YouTube.
A national headline is written for the whole country. Your price gets written one street at a time.
FAQ: Making Sense of Home Price Headlines
Why do some headlines say home prices are falling while others say they are rising?
They are usually measuring different things. Some track national asking prices, which drop every fall, while others track closed sale prices in specific cities, where results vary widely.
How much have national asking prices dropped this fall?
According to HousingWire Data, the national median asking price fell from $449,000 in early August to $435,000 two months later, a dip of about 3% that lines up with the usual seasonal slowdown.
Are Austin home prices going up or down right now?
Both, depending on the month. Unlock MLS reported the City of Austin median down 4.3% to $560,000 in August 2026, then up 4.2% to $570,958 in September 2026.
How are home prices holding up in Mueller?
Mueller's median price for the third quarter of 2026 rose 3% year-over-year, even with 7% fewer closed sales. Single-family homes closed at a median of $962,360 in September.
Is the housing market heading for a crash?
The data does not point to one. In the major metros where prices are down, the declines are 2% or less, and the FHFA reports national prices have grown year-over-year every quarter since 2012.
Should I cut my asking price because of national headlines?
Not based on national numbers alone. Your price should come from recent comparable sales in your own neighborhood and price range, which a local agent like Kathy Sokolic can pull for you.
Where can I follow monthly Mueller home price data?
I share monthly Mueller numbers in her Real Estate Market Updates playlist on YouTube and in my market update posts at kathysokolicrealtor.com.